VaasaETT report - Household Energy Price Index for Europe
KEY FINDINGS AS OF DECEMBER 2011
Prices have been rather stable this month except for electricity in Berlin which saw a rather big jump. Total electricity prices in German’s capital increased by approximately 1.5 Cent/kWh compared to last month.
Several other price increases have already been announced for next year. France’s regulated natural gas price will increase by 4.4% as of January 2012. In Germany, a survey by Verivox (a leading price comparison website) found that “62 power companies intend to raise prices in December or January by an average of three percent while 53 gas suppliers will increase prices by around eight percent on average”. It cites subsidies levied on German consumers to support renewable power, higher wholesale market prices and higher transmission grid fees. The reasons for gas price increases are rising crude oil prices, to which the bulk of gas procurement prices are still index-linked with a time lag of around six months.
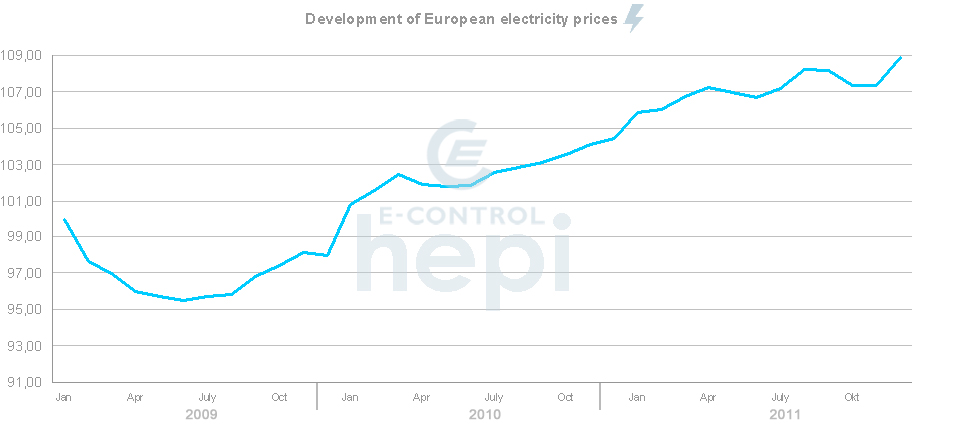
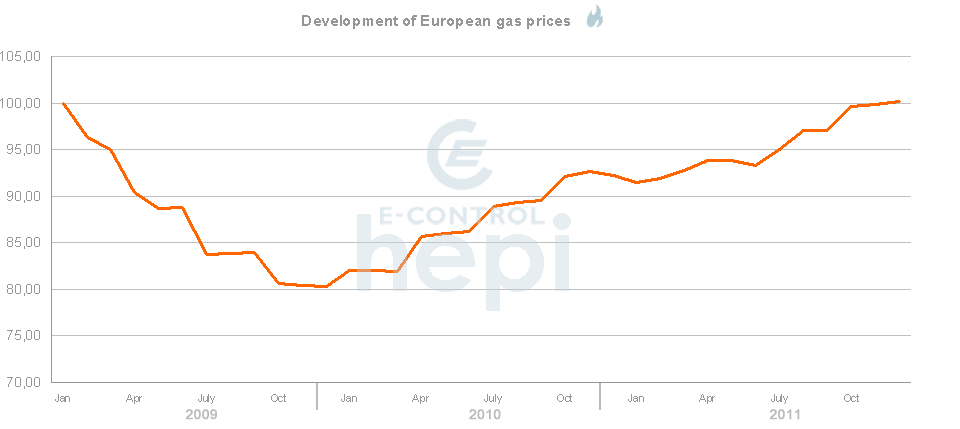
The index shows that residential electricity prices steadily decreased over the first half of 2009 but started continuously rising from 2010 on and reached a new peak this month (108,9 index points). The price index for gas dropped significantly in 2009 and reached its lowest value only in December at 80.3 index points (six months after the electricity price index). Retail prices started to recover in December 2009 – January 2010 when a cold wave hit many parts of Europe. The index regained to its January 2009 level this month (100 index points).
The “Total Price Rankings” table shows that depending on where a customer lives in Europe, the price that customer has to pay can vary by almost 140% per kWh of electricity and by a staggering 380% per kWh of gas. Household customers in Copenhagen pay by far the highest electricity price within the capital cities of the EU-15 (though 55% is made up of taxes), while customers in Athens pay the least. Natural gas household customers in Stockholm pay by far the most within the capital cities of the EU-15 where end-user prices are over 70% higher than in the second most expensive city Copenhagen and close to five times as much as in the British capital city where Londoners enjoy by far the lowest prices. The incredibly high prices in Stockholm can largely be explained by the limited size of the residential market (there are only about 44,000 household gas customers in the whole of Sweden) and the fact that gas heating is almost nonexistent in Sweden.
The breakdown of end-user energy prices into four components (energy, distribution, energy taxes and VAT) also shows major variations. Our survey shows that on average, the electricity price component (including retail margins) represents about 45% of the total cost, distribution 30%, energy taxes 12% and VAT 14%, whereas the natural gas price component (including retail margins) represents 53% of the total cost, distribution 24%, energy taxes 9% and VAT 14%. Copenhagen is a very unusual case; the cost of electricity as a commodity represents less than a fourth of the end-user price, by far the lowest of all surveyed cities, whereas the energy taxes represent an astonishing 35% (about three times the EU-15 average) and 55% if we include VAT. Overall, the results show that market forces represent only about half of the end-user price (both for electricity and gas) whereas national fiscal and regulatory elements are responsible for the other half through distribution tariffs, energy taxes and VAT.
EUROPEAN ENERGY PRICE DEVELOPMENT (EXCLUDING TAXES)
TOTAL PRICE RANKINGS (INCLUDING ENERGY, DISTRIBUTION AND TAXES)
ENERGY PRICE BREAKDOWN